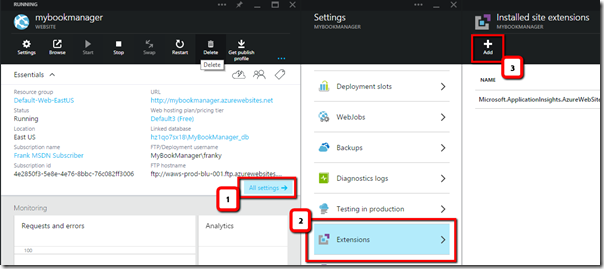
Application Insights is an incredible tool that will brings to you a gigantic quantity of information about your application. In a previous post:
Tons statistics and metrics for Microsoft Azure websites (not only in Asp.Net), I was explaining how to get started with App Insights. In this post, I want to explain how you can create your own customs events or metrics.
The setup
I will use an Asp.Net MVC named
SimpleWebApp that will consume an Azure Api App named
FrankApiApp. For the demo purposes I will have both projects in the same solution, but let's pretend that the ApiApp is not us, and that we don't control what inside.
To create an Azure Api App you will need Visual Studio 2015 or Visual Studio 2013 with minimum Azure SDK 2.6 installed. When creating the app, select Asp.Net Web Application, then Azure Api App (Preview).

For this post, we simply need one function. Here the code of the Get method that will wait and return us a string:
    // GET api/values
    public IEnumerable<string> Get()
    {
        var rnd = new Random();
        var waitFor = rnd.Next(500, 3000);

        System.Threading.Thread.Sleep(waitFor);
        var msg = String.Format("You have wait {0}. Sorry about that.", waitFor);

        return new string[] { waitFor.ToString(), msg };
    }
The application where telemetries will be added is a simple Asp.Net Web Application with MVC, created with the default template in Visual Studio. To add App Insights, just right-click on the project and select Add Application Insights Telemetry.

Now we need to add a reference of the Azure API App. That could be easily done. Right-click, once again, on the project and Select Add, then Azure API App Client. A new window will appear, and we only need to select our just deployed API App.
![Select_API_App[3] Select_API_App[3]](https://blogger.googleusercontent.com/img/b/R29vZ2xl/AVvXsEiz6Kk4DnxyehjP9Da0sYqwMWtBSqoMmXIYPDgYBcrPsSpnpnIs3N_2e4nPx0WbDk2qCTFz5MggorwU1a8HnWn-efYc75uIvlifWLbxDMABiByAlsNBlzXF1vI_i9Zx6LePt4p9tnMuHoc/?imgmax=800)
The Base
Of course, just by adding the code spinet to the head of _Layout.cshtml you will have a lot of information about your server, your application but also the client experience and browser. This is all very useful, and it worth the time to navigate/ dig in the Azure portal to understand how your application is going/ doing.
Custom Metric
An interesting information could be to measure the time for each call to FrankApiApp. Let's started by adding a custom metric. To do that we will add a function in the HomeController and a new tab in that menu of the _Layout.cshtml.
public class HomeController : Controller
{
    private TelemetryClient appInsights = new TelemetryClient();

    public ActionResult ApiCall()
    {
        var stopwatch = System.Diagnostics.Stopwatch.StartNew();
        var client = new FrankApiApp();
        var result = client.Values.Get();

        stopwatch.Stop();

        ViewBag.Message = result[1];

        appInsights.TrackMetric("TimeDoingNothing", stopwatch.Elapsed.TotalSeconds);

        return View("Contact");
    }
}
First, we create an instance of TelemetryClient. Then before calling the FrankApiApp's Get method we start a stopwatch. And we just need to use the
TrackMetric method to push the metric.
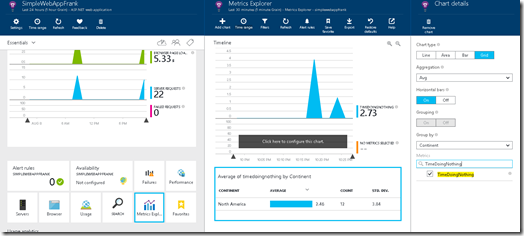
After deploying and navigating a little in the application, let see what's we have available for us. Open portal.azure.com, and navigate to your application Insights. Click on the Metrics Explorer, a new blade now open with three empty charts. Click on the timeline, then in the Metric texbox type "TimeDoingNothing" (new metric's name). Now, click on the grid (third chart), add the metric name and select Group By Continent. Interesting right?!

Even more
Application Insight gives the opportunity to track many things: PageViews, Events, Exception, Requests, Trace and of course Metrics. Here some alternative of our ApiCall function using the TrackEvent and TrackRequest.
// Using TrackEvent
public ActionResult ApiCall()
{
    var stopwatch = System.Diagnostics.Stopwatch.StartNew();

    var client = new FrankApiApp();
    var result = client.Values.Get();
    stopwatch.Stop();

    ViewBag.Message = result[1];

    var metrics = new Dictionary<string, double> {{"processingTime", stopwatch.Elapsed.TotalMilliseconds}};
    var properties = new Dictionary<string, string>  {{ "MessageSuggestedElapsed", result[0] } };

    // Send the event:
    appInsights.TrackEvent("APICallProcessed", properties, metrics);
    appInsights.TrackMetric("TimeDoingNothing", stopwatch.Elapsed.TotalSeconds);

    return View("Contact");
}


// Using TrackRequest
public ActionResult ApiCallWithTelemetry()
{
    appInsights.Context.Operation.Id = Guid.NewGuid().ToString();

    var stopwatch = System.Diagnostics.Stopwatch.StartNew();
    var client = new FrankApiApp();
    var result = client.Values.Get();

    stopwatch.Stop();

    ViewBag.Message = result[1];

    // Send the event:
    appInsights.TrackRequest("APICallRequest", DateTime.UtcNow, stopwatch.Elapsed, "200", true);
    appInsights.TrackMetric("TimeDoingNothing", stopwatch.Elapsed.TotalSeconds);

    return View("Contact");
}
Wrap it up
I couldn't show everything in one post, it's up to you to create new metrics, events and query them in Azure Application Insights. Share your discovery or questions in the comment section bellow.
References


![Select_API_App[3] Select_API_App[3]](https://blogger.googleusercontent.com/img/b/R29vZ2xl/AVvXsEiz6Kk4DnxyehjP9Da0sYqwMWtBSqoMmXIYPDgYBcrPsSpnpnIs3N_2e4nPx0WbDk2qCTFz5MggorwU1a8HnWn-efYc75uIvlifWLbxDMABiByAlsNBlzXF1vI_i9Zx6LePt4p9tnMuHoc/?imgmax=800)


 Suggestion of the week